
MARKET INSIGHTS | AUGUST 2020
News & CommentaryBy: Christopher D. Ross, CFP®
Aug 06, 2020
U.S. Markets
Stock prices rallied in July as further development of a COVID-19 vaccine and better-than-expected corporate financial reports encouraged investors.The S&P 500 gained 5.5 percent, while the Nasdaq Composite picked up 6.8 percent. The Dow Industrial Average, which has lagged much of the year, rose 2.4 percent. 1
Confident Investors
Stock prices started the month elevated, thanks to early results from a COVID-19 vaccine trial, a better-than-expected jobs report, and a higher-than-anticipated reading on manufacturing activity. Despite multiple states reporting increases in infections, stocks continued their climb, especially in the mega-cap technology companies. Meanwhile, investors remained confident, even as multiple regional Federal Reserve presidents warned of a bumpy economic recovery.
Earnings Update
As of July 31, more than half of the companies comprising the S&P 500 Index reported their earnings. Of these companies, 84 percent reported earnings in excess of analysts’ estimates, with the Health Care and Technology sectors leading the way. 2 In the final week of trading, investor sentiment alternated between worry and optimism. A disappointing jobless claims report and a stunning second-quarter GDP number caused some worry. But the mega-cap technology names reported exceptional earnings, capping off a strong month for the equity markets.
Sector Scorecard
Industry sectors were uniformly higher in July, except for a loss in the Energy sector (-4.36 percent). Gains were made in Communication Services (+6.09 percent), Consumer Discretionary (+6.72 percent), Consumer Staples (+7.03 percent), Financials (+3.80 percent), Health Care (+6.07 percent), Industrials (+4.80 percent), Materials (+7.01 percent), Real Estate (+4.28 percent), Technology (+3.11 percent), and Utilities (+7.62 percent). 3
U.S. Market Recap for July 2020
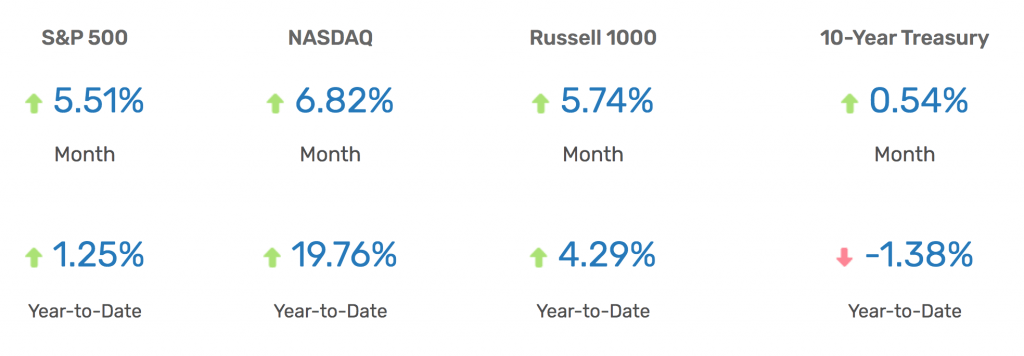
Yahoo Finance, July 31, 2020. The market indexes discussed are unmanaged and generally considered representative of their respective markets. Individuals cannot directly invest in unmanaged indexes. Past performance does not guarantee future results. U.S. Treasury Notes are guaranteed by the federal government as to the timely payment of principal and interest. However, if you sell a Treasury Note prior to maturity, it may be worth more or less than the original price paid.
What Investors May Be Talking About in August
In the last ten years, August has gained a reputation for being one of the more volatile months of the year. For instance, in August of 2019, the S&P 500 Index posted moves of more than one percent in 11 of the 22 trading days, with three daily drops of more than 2.6 percent. At the time, trade friction with China was escalating, and some market watchers suggested that the bond market was signaling a recession on the horizon. 4,5 One of the reasons for the past volatility is that some traders are away on vacation, resulting in lighter volume, which may have the effect of amplifying market volatility. But this year may be different since many people are staying closer to home due to the pandemic. This August will stand on its own merits. But investors should be prepared for headlines that could result in outsized moves.
World Markets
Overseas markets were mixed. Optimism for the development of a COVID-19 vaccine was offset by continued tension between the U.S. and China. The MSCI-EAFE Index advanced 2.23 percent. 6 European stocks trended lower as multiple economies continued to reopen, and the European Union agreed to a fiscal stimulus package for member nations. German shares edged higher, while France lost ground. 7 Pacific Rim stocks were mixed. Australia rose 0.51 percent, while Japan fell 2.59 percent. The volatile Argentinian market rose nearly 28 percent. 8
Indicators
Gross Domestic Product
The economy contracted by an annualized rate of 32.9 percent in the second-quarter GDP. 9
Employment
The unemployment rate declined in June to 11.1 percent (from May’s 13.3 percent rate) as the economy added 4.8 million jobs. 10
Retail Sales
Consumer spending rose 7.5 percent in June, aided by the reopening of malls and restaurants. Sales were largely driven by autos, clothing, furniture, and electronics. 11
Industrial Production
Output by the nation’s manufacturers, utilities, and mines increased by 5.4 percent. Manufacturing jumped by 7.2 percent. 12
Housing
Housing starts leaped by 17.3 percent; though, new construction remains behind last year’s pace. 13 Posting its largest monthly jump ever, existing home sales soared 20.7 percent in June. 14 New home sales rose 13.8 percent, touching its highest sales pace in 13 years. 15
Consumer Price Index
Consumer inflation jumped 0.6 percent in June, which economists attributed to a snapback in prices from COVID-19-related declines in the previous three months. Gasoline prices soared 12.3 percent, accounting for more than half of the month’s increase in the CPI. 16
Durable Goods Orders
Durable goods orders increased 7.3 percent, as an 86 percent leap in orders for new cars and trucks offset a sharp drop in aircraft manufacturing. 17
The Fed
As expected, the Federal Reserve left its benchmark interest rate unchanged at its two-day meeting, which ended July 29. The Fed also reiterated its commitment to bond purchases and the lending and liquidity programs it currently has in place. 18
1. The Wall Street Journal, July 31, 2020
2. FactSet Research, July 31, 2020
3. FactSet Research, July 31, 2020
4. CNBC.com, August 31, 2019
5. MarketWatch, August 1, 2019
6. MSCI.com, July 31, 2020
7. MSCI.com, July 31, 2020
8. MSCI.com, July 31, 2020
9. The Wall Street Journal, July 30, 2020
10. The Wall Street Journal, July 2, 2020
11. The Wall Street Journal, July 16, 2020
12. The Wall Street Journal, July 15, 2020
13. CNBC.com, July 17, 2020
14. The Wall Street Journal, July 22, 2020
15. MarketWatch.com, July 24, 2020
16. The Wall Street Journal, July 14, 2020
17. MarketWatch.com, July 27, 2020
18. CNBC.com, July 29, 2020
The content is developed from sources believed to be providing accurate information. The information in this material is not intended as tax or legal advice. Please consult legal or tax professionals for specific information regarding your individual situation. This material was developed and produced by FMG Suite to provide information on a topic that may be of interest. FMG Suite, LLC, is not affiliated with Alliance Wealth Advisors, LLC.
The opinions expressed and material provided are for general information and should not be considered a solicitation for the purchase or sale of any security.
Investing involves risks, and investment decisions should be based on your own goals, time horizon and tolerance for risk. The return and principal value of investments will fluctuate as market conditions change. When sold, investments may be worth more or less than their original cost.
Any companies mentioned are for illustrative purposes only. It should not be considered a solicitation for the purchase or sale of the securities. Any investment should be consistent with your objectives, timeframe, and risk tolerance.
The forecasts or forward-looking statements are based on assumptions, subject to revision without notice, and may not materialize.
The market indexes discussed are unmanaged and generally considered representative of their respective markets. Individuals cannot directly invest in unmanaged indexes. Past performance does not guarantee future results.
The Dow Jones Industrial Average is an unmanaged index that is generally considered representative of large-capitalization companies on the U.S. stock market. The S&P 500 Composite Index is an unmanaged group of securities considered to be representative of the stock market in general. The Nasdaq Composite is an index of the common stocks and similar securities listed on the Nasdaq stock market and considered a broad indicator of the performance of stocks of technology and growth companies. The Russell 1000 Index is an index that measures the performance of the highest-ranking 1,000 stocks in the Russell 3000 Index, which is comprised of 3,000 of the largest U.S. stocks. The MSCI EAFE Index was created by Morgan Stanley Capital International (MSCI) and serves as a benchmark for the performance in major international equity markets, as represented by 21 major MSCI indexes from Europe, Australia, and Southeast Asia. Index performance is not indicative of the past performance of a particular investment. Past performance does not guarantee future results. Individuals cannot invest directly in an index. The return and principal value of stock prices will fluctuate as market conditions change. And shares, when sold, may be worth more or less than their original cost.
International investments carry additional risks, which include differences in financial reporting standards, currency exchange rates, political risks unique to a specific country, foreign taxes and regulations, and the potential for illiquid markets. These factors may result in greater share price volatility.
The Hang Seng Index is a benchmark index for the blue-chip stocks traded on the Hong Kong Stock Exchange. The KOSPI is an index of all stocks traded on the Korean Stock Exchange. The Nikkei 225 is a stock market index for the Tokyo Stock Exchange. The SENSEX is a stock market index of 30 companies listed on the Bombay Stock Exchange. The Jakarta Composite Index is an index of all stocks that are traded on the Indonesia Stock Exchange. The Bovespa Index tracks 50 stocks traded on the Sao Paulo Stock, Mercantile, & Futures Exchange. The IPC Index measures the companies listed on the Mexican Stock Exchange. The MERVAL tracks the performance of large companies based in Argentina. The ASX 200 Index is an index of stocks listed on the Australian Securities Exchange. The DAX is a market index consisting of the 30 German companies trading on the Frankfurt Stock Exchange. The CAC 40 is a benchmark for the 40 most significant companies on the French Stock Market Exchange. The Dow Jones Russia Index measures the performance of leading Russian Global Depositary Receipts (GDRs) that trade on the London Stock Exchange. The FTSE 100 Index is an index of the 100 companies with the highest market capitalization listed on the London Stock Exchange.
Please consult your financial professional for additional information. Copyright 2020 FMG Suite.