What is Normal?
Investment ManagementJan 10, 2022
Market volatility always prompts calls and e-mails from clients and friends asking us if the market is going to crash. Some people flat out tell us that this is it. There are always headlines exacerbating the negativity. The reality is nobody ever really knows how things will play out. What they do know is that fear sells. The permabears come out of their caves getting more airtime calling for the same 50% drop that they’ve been calling for years and in some cases, decades. The only problem is that a significant drop from current levels would likely leave the market substantially higher than where it was when they started proclaiming their thesis to anyone who will listen.
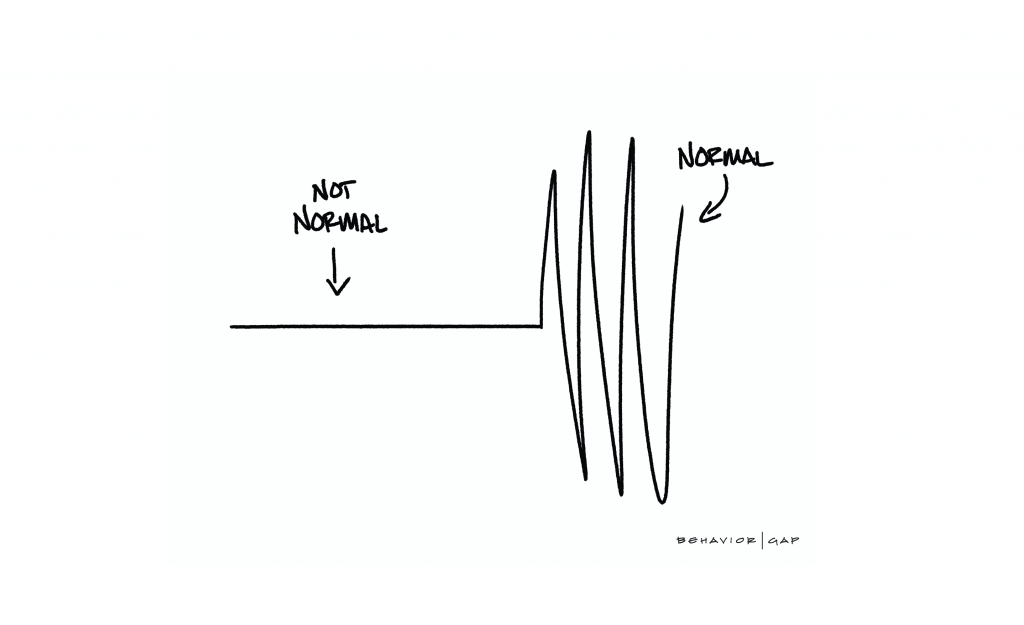
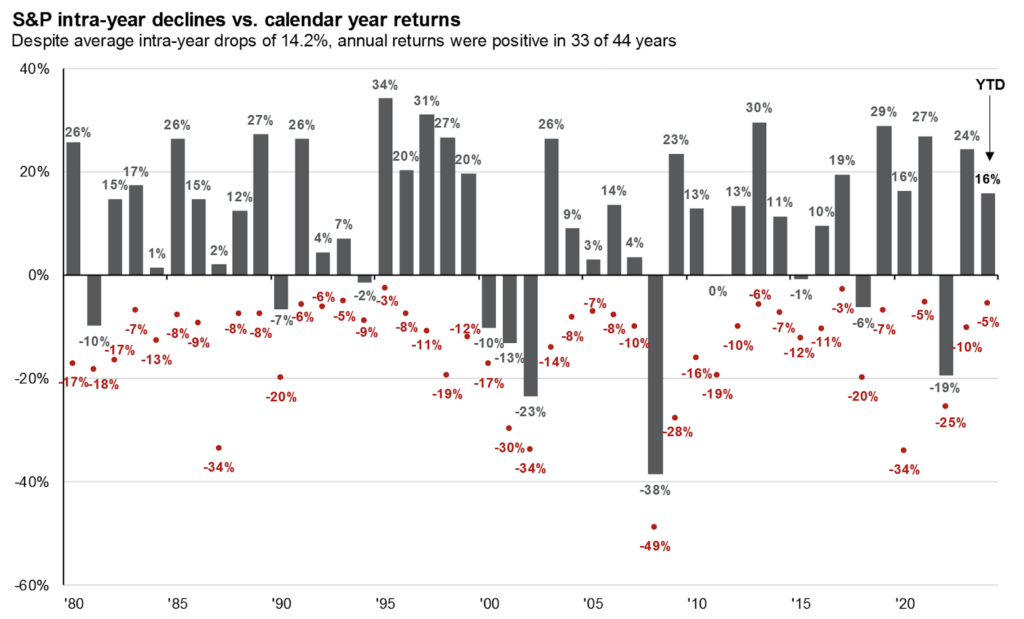
Corrections are not enjoyable. We talk about them, prepare for them by diversifying our accounts, and understand that it is part of investing. However, it still is not a good feeling when it happens. In times like these, we have to remember that whether we like it or not, corrections are normal. chart below from J.P. Morgan says it all. The market experiences an average intra-year drop of 14% going back to 1980. In fact, there have only been 4 years since 1980 with an intra-year drawdown of 5% or less. The rest had drawdowns of 6% or more. Despite that, 33 of the 44 years had positive returns.

While you always have to acknowledge the headlines in front of you, it is important to put things into perspective. Volatility is part of investing. It serves as a reminder of why we diversify. There is an old saying that markets climb a wall of worry, and it is very applicable during volatile times when you’re ready to throw in the towel. To take it a step further, when do things ever feel perfect? Those are usually the euphoric moments where the black swan comes in and brings us back to reality. In the end, short term predictions are just noise. Making a plan and committing to an asset allocation that fits your risk profile will win in the end.
Chart Source: FactSet, Standard & Poor’s, J.P. Morgan Asset Management.
Returns are based on price index only and do not include dividends. Intra-year drops refers to the largest market drops from a peak to a trough during the year. For illustrative purposes only. Returns shown are calendar year returns from 1980 to 2023, over which time period the average annual return was 10.3%. JPM Guide to the Markets – U.S. Data are as of July 31, 2024.


