
Market Insights | October 2020
News & CommentaryOct 14, 2020
U.S. Markets
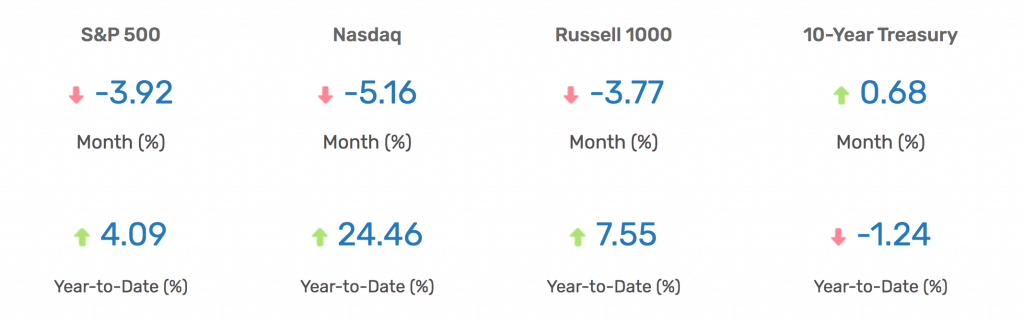
Stocks dropped in September as investors worried about stalled fiscal stimulus talks in Washington, the upcoming election, and new coronavirus cases in Europe.
The Dow Jones Industrial Average, which lagged this year slipped 2.28 percent. The Standard & Poor’s 500 Index lost 3.92 percent and the Nasdaq Composite declined 5.16 percent. 1
Tech Stock Under Pressure
After a strong rally in August, investor sentiment quickly turned negative as technology stocks dragged down the overall market.
The retreat in the technology sector gathered steam as the month wore on, sending the tech-heavy Nasdaq Composite into correction territory over a three-day span following a recent record high. A correction is defined as a decline of at least 10 percent but not more than 20 percent from a recent high. 2
A Few Bright Spots
The month did offer moments of optimism, however, that sparked brief rallies, such as an increase in merger and acquisition deals and further reported progress on a COVID-19 vaccine. However, concerns about the November election, the fading hopes for a fiscal stimulus bill, and an increase in European COVID-19 cases weighed heavily on investor sentiment.
As September came to a close, the market cut its losses, surging on the final two days of trading as legislators appeared to reopen fiscal stimulus talks.
Sector Scorecard
All 11 industry sectors were lower in September, with losses in Communication Services (−6.61 percent), Consumer Discretionary (−3.15 percent), Consumer Staples (−3.71 percent), Energy (−17.56 percent), Financials (−6.35 percent), Health Care (−3.87 percent), Industrials (−2.04 percent), Materials (−1.52 percent), Real Estate (−4.05 percent), Technology (−6.03 percent), and Utilities (−0.37 percent).3
U.S. Market Recap for September 2020
Yahoo Finance, September 30, 2020. The market indexes discussed are unmanaged and generally considered representative of their respective markets. Individuals cannot directly invest in unmanaged indexes. Past performance does not guarantee future results. U.S. Treasury Notes are guaranteed by the federal government as to the timely payment of principal and interest. However, if you sell a Treasury Note prior to maturity, it may be worth more or less than the original price paid.
What Investors May Be Talking About in October
The housing sector has been a bright spot in a challenging year and has seen strong consumer demand thanks to historically low interest rates.
Home building and home sales have set new records in recent months, while home builder confidence is at an all-time high. The National Association of Home Builders/Wells Fargo Housing Market Index posted a reading of 83 out of a possible 100 in September, well above its previous record high of 78. 4,5
Housing accounts for 15 percent of the nation’s gross domestic product, so investors may watch for the sector to retain its momentum in the fourth quarter and into 2021. 6
World Markets
International markets struggled amid more coronavirus cases in Europe and concerns over the tensions between the U.S. and China.
The MSCI-EAFE Index fell 2.20 percent in September. 7
European markets were broadly weaker. France dropped 2.91 percent, Germany lost 1.43 percent, and the U.K. slipped 1.68 percent. 8
Pacific Rim stocks were mixed as Australia fell 4.04 percent and Hong Kong declined 6.82 percent. Japan notched a solid gain, tacking on 9.68 percent. 9
Indicators
Gross Domestic Product
The final reading of the second-quarter GDP showed an annualized decline of 31.4 percent. 10
Employment
The unemployment rate dropped to 8.4 percent as employers added 1.4 million jobs in August. 11
Retail Sales
Retail sales growth slowed in August, rising only 0.6 percent as the supplemental unemployment benefits expired at the end of July. The benefits helped buyers in prior months. 12
Industrial Production
Industrial output rose 0.4 percent, below economists’ expectations of a 1 percent increase. 13
Housing
Housing starts fell 5.1 percent after sharp gains in the previous three months. Single-family home starts increased by 4.1 percent, but the overall result was dragged down by a 22.7 percent decline in multi-family starts. 14
Existing home sales rose 2.4 percent from July and were 10.5 percent higher than August of last year. 15
Sales of new homes rose to their highest level in almost 14 years, posting a 4.8 percent increase from the previous month. 16
Consumer Price Index
Consumer prices jumped 0.4 percent in August, led by the sharpest increase in the cost of used cars and trucks in more than 50 years. On a year-over-year basis, inflation rose 1.3 percent. 17
Durable Goods Orders
For the fourth straight month durable goods orders rose, increasing by 0.4 percent in August. New orders for nondefense capital goods, excluding aircraft, jumped 1.8 percent. 18
The Fed
The Federal Reserve signaled that interest rates would likely not increase until 2023 following its two-day Federal Open Market Committee (FOMC) meeting that ended on September 16. 19
Fed officials also stressed the importance of additional fiscal stimulus. 19
Fed officials adjusted their outlook for unemployment, predicting it would average between 7 and 8 percent in the final three months of the year. Previously, Fed officials had expected unemployment of between 9 and 10 percent in the final calendar quarter of 2020. 19
1. The Wall Street Journal, September 30, 2020
2. MarketWatch.com, September 12, 2020
3. FastSet Research, September 30, 2020
4. CNBC.com, September 22, 2020
5. EyeOnHousing.com, September 16, 2020
6. Federation of American Scientists, October 2, 2019
7. MSCI.com, September 30, 2020
8. MSCI.com, September 30, 2020
9. MSCI.com, September 30, 2020
10. CNBC.com, September 30, 2020
11. The Wall Street Journal, September 4, 2020
12. The Wall Street Journal, September 16, 2020
13. The Wall Street Journal, September 15, 2020
14. CNBC.com, September 17, 2020
15. CNBC.com, September 22, 2020
16. CNBC.com, September 24, 2020
17. CNBC.com, September 11, 2020
18. The Wall Street Journal, September 25, 2020
19. The Wall Street Journal, September 16, 2020
The content is developed from sources believed to be providing accurate information. The information in this material is not intended as tax or legal advice. Please consult legal or tax professionals for specific information regarding your individual situation. This material was developed and produced by FMG Suite to provide information on a topic that may be of interest. FMG Suite, LLC, is not affiliated with Alliance Wealth Advisors, LLC.
The opinions expressed and material provided are for general information and should not be considered a solicitation for the purchase or sale of any security.
Investing involves risks, and investment decisions should be based on your own goals, time horizon and tolerance for risk. The return and principal value of investments will fluctuate as market conditions change. When sold, investments may be worth more or less than their original cost.
Any companies mentioned are for illustrative purposes only. It should not be considered a solicitation for the purchase or sale of the securities. Any investment should be consistent with your objectives, timeframe, and risk tolerance.
The forecasts or forward-looking statements are based on assumptions, subject to revision without notice, and may not materialize.
The market indexes discussed are unmanaged and generally considered representative of their respective markets. Individuals cannot directly invest in unmanaged indexes. Past performance does not guarantee future results.
The Dow Jones Industrial Average is an unmanaged index that is generally considered representative of large-capitalization companies on the U.S. stock market. The S&P 500 Composite Index is an unmanaged group of securities considered to be representative of the stock market in general. The Nasdaq Composite is an index of the common stocks and similar securities listed on the Nasdaq stock market and considered a broad indicator of the performance of stocks of technology and growth companies. The Russell 1000 Index is an index that measures the performance of the highest-ranking 1,000 stocks in the Russell 3000 Index, which is comprised of 3,000 of the largest U.S. stocks. The MSCI EAFE Index was created by Morgan Stanley Capital International (MSCI) and serves as a benchmark for the performance in major international equity markets, as represented by 21 major MSCI indexes from Europe, Australia, and Southeast Asia. Index performance is not indicative of the past performance of a particular investment. Past performance does not guarantee future results. Individuals cannot invest directly in an index. The return and principal value of stock prices will fluctuate as market conditions change. And shares, when sold, may be worth more or less than their original cost.
International investments carry additional risks, which include differences in financial reporting standards, currency exchange rates, political risks unique to a specific country, foreign taxes and regulations, and the potential for illiquid markets. These factors may result in greater share price volatility.
The Hang Seng Index is a benchmark index for the blue-chip stocks traded on the Hong Kong Stock Exchange. The KOSPI is an index of all stocks traded on the Korean Stock Exchange. The Nikkei 225 is a stock market index for the Tokyo Stock Exchange. The SENSEX is a stock market index of 30 companies listed on the Bombay Stock Exchange. The Jakarta Composite Index is an index of all stocks that are traded on the Indonesia Stock Exchange. The Bovespa Index tracks 50 stocks traded on the Sao Paulo Stock, Mercantile, & Futures Exchange. The IPC Index measures the companies listed on the Mexican Stock Exchange. The MERVAL tracks the performance of large companies based in Argentina. The ASX 200 Index is an index of stocks listed on the Australian Securities Exchange. The DAX is a market index consisting of the 30 German companies trading on the Frankfurt Stock Exchange. The CAC 40 is a benchmark for the 40 most significant companies on the French Stock Market Exchange. The Dow Jones Russia Index measures the performance of leading Russian Global Depositary Receipts (GDRs) that trade on the London Stock Exchange. The FTSE 100 Index is an index of the 100 companies with the highest market capitalization listed on the London Stock Exchange.
Please consult your financial professional for additional information. Copyright 2020 FMG Suite.