
Market Insights | September 2020
News & CommentaryBy: Christopher D. Ross, CFP®
Sep 08, 2020
U.S. Markets
Stock prices surged in August as investors cheered positive news of a potential COVID-19 treatment and welcomed a month-long succession of upbeat economic data.
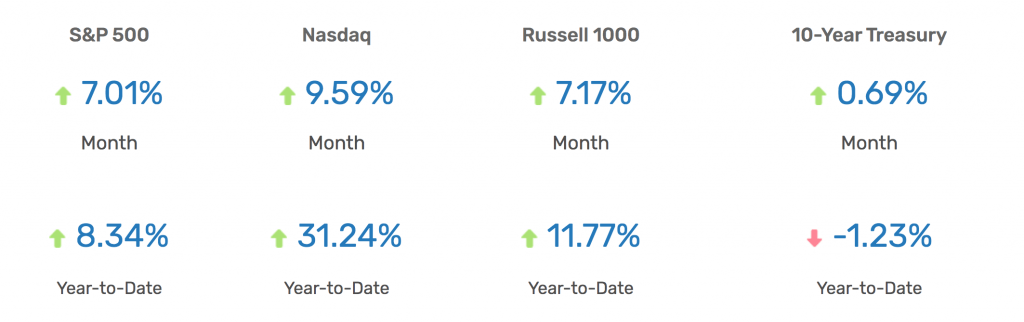
The Dow Jones Industrial Average rose 7.57 percent, the Standard & Poor’s 500 Index climbed 7.01 percent, and the Nasdaq Composite soared 9.59 percent. 1
Solid Foundation
The month’s foundation was set by a series of strong economic reports, including an increase in manufacturing activity, better-than-anticipated factory orders, and a lessening of new jobless claims. 2,3,4
Notching Highs
The S&P 500 index finally broke through resistance, ending the third week of August at a record high and completing the fastest bear market recovery in history. The Nasdaq Composite, having set multiple record highs during the same week, also ended the month at a record high. 5,6
Strong Close to the Month
The final full week of trading was remarkable. Investors were encouraged by news of a potential COVID-19 treatment and a report suggesting U.S. and China negotiators had met to discuss trade issues. Stocks pushed higher still following announcement of the Fed’s inflation policy shift, suggesting that interest rates may remain low for longer than expected.
Sector Scorecard
The majority of industry sectors closed higher in August, with gains in Communication Services (+12.02 percent), Consumer Discretionary (+11.48 percent), Consumer Staples (+4.95 percent), Financials (+5.62 percent), Health Care (+2.11 percent), Industrials (+9.98 percent), Materials (+4.89 percent), Real Estate (+1.81 percent), and Technology (+16.62 percent). Energy (-1.27 percent) and Utilities (-2.28 percent) lost ground. 7
U.S. Market Recap for August 2020
Yahoo Finance, August 31, 2020. The market indexes discussed are unmanaged and generally considered representative of their respective markets. Individuals cannot directly invest in unmanaged indexes. Past performance does not guarantee future results. U.S. Treasury Notes are guaranteed by the federal government as to the timely payment of principal and interest. However, if you sell a Treasury Note prior to maturity, it may be worth more or less than the original price paid.
What Investors May Be Talking About in September
The election season is moving into high gear as November draws near. Will uncertainty about the elections be reflected in the stock market?
Since 1992, the S&P 500 has lost an average of 2 percent in the three months leading up to the presidential election but has been higher 43 percent of the time.8
Keep in mind that the 2 percent average includes the 20 percent drop prior to the 2008 election that was the result of the ongoing credit crisis.9
While past performance is no guarantee of future results, the lesson may be evident: Prepare for some short-term volatility, without losing sight of your overall investment strategy.
World Markets
Markets overseas generally trended higher with the MSCI-EAFE Index rising 4.98 percent in August.10
European markets rose on hopes of a COVID-19 vaccine and another round of economic stimulus. Major markets ended higher, with France gaining 3.42 percent and Germany advancing 5.13 percent. The U.K. lagged a bit, tacking on just 0.70 percent. 11
Pacific Rim stocks turned higher, with Australia picking up 2.24 percent and Hong Kong climbing 2.37 percent. Japan had a strong showing, adding 6.59 percent. 12
Indicators
Gross Domestic Product
Second-quarter GDP contraction was revised from 32.9 percent to 31.7 percent. 13
Employment
The labor market continued to improve, albeit at a slower pace. Employers added 1.8 million jobs in July, and the unemployment rate fell to 10.2 percent. 14
Retail Sales
Consumer spending rose a lower-than-expected 1.2 percent in July. Slower sales of electronics and appliances were offset by an increase in restaurant and bar sales. 15
Industrial Production
Output by the nation’s manufacturers, miners, and utilities rose 3.0 percent. To put that number in perspective, industrial production hit 8.4 percent in February. 16
Housing
Housing starts surged in July, increasing by 22.6 percent. 17
Existing home sales soared 24.7 percent, representing the biggest monthly gain since 1968, when tracking of existing home sales began. 18
New home sales jumped by 13.9 percent, reaching their highest level in over 13 years. 19
Consumer Price Index
Prices of consumer goods rose 0.6 percent in July, with gasoline prices contributing to the increase. 20
Durable Goods Orders
Orders for products designed to last three years or longer gained 11.3 percent, rising for the third consecutive month, as defense aircraft and motor vehicle orders led the way. 21
The Fed
Minutes from July’s meeting were released on August 19.
The Federal Open Market Committee (FOMC) appeared to favor more monetary accommodation, though Fed officials were unclear as to the timing or triggers for taking further policy action.
In a prepared statement, the FOMC said, “The path of the economy would depend significantly on the course of the virus.”
In addition, FOMC members believe that the “…ongoing public health crisis would weigh heavily on economic activity, employment, and inflation in the near term…” causing members to maintain the target range for the federal funds rate at 0 to ¼ percent. 22
1. The Wall Street Journal, August 31, 2020
2. Barrons.com, August 6, 2020
3. MarketWatch, August 3, 2020
4. MarketWatch, August 27, 2020
5. The Wall Street Journal, August 18, 2020
6. The Wall Street Journal, August 31, 2020
7. FastSet Research, August 31, 2020
8. CNBC.com, August 10, 2020
9. CNBC.com, August 10, 2020
10. MSCI.com, August 31, 2020
11. MSCI.com, August 31, 2020
12. MSCI.com, August 31, 2020
13. CNBC.com, August 27, 2020
14. The Wall Street Journal, August 7, 2020
15. CNBC.com, August 14, 2020
16. APNews.com, August 14, 2020
17. CNBC.com, August 18, 2020
18. The Wall Street Journal, August 21, 2020
19. FoxBusiness.com, August 25, 2020
20. The Wall Street Journal, August 12, 2020
21. The Wall Street Journal, August 26, 2020
22. The Wall Street Journal, August 19, 2020
The content is developed from sources believed to be providing accurate information. The information in this material is not intended as tax or legal advice. Please consult legal or tax professionals for specific information regarding your individual situation. This material was developed and produced by FMG Suite to provide information on a topic that may be of interest. FMG Suite, LLC, is not affiliated with Alliance Wealth Advisors, LLC.
The opinions expressed and material provided are for general information and should not be considered a solicitation for the purchase or sale of any security.
Investing involves risks, and investment decisions should be based on your own goals, time horizon and tolerance for risk. The return and principal value of investments will fluctuate as market conditions change. When sold, investments may be worth more or less than their original cost.
Any companies mentioned are for illustrative purposes only. It should not be considered a solicitation for the purchase or sale of the securities. Any investment should be consistent with your objectives, timeframe, and risk tolerance.
The forecasts or forward-looking statements are based on assumptions, subject to revision without notice, and may not materialize.
The market indexes discussed are unmanaged and generally considered representative of their respective markets. Individuals cannot directly invest in unmanaged indexes. Past performance does not guarantee future results.
The Dow Jones Industrial Average is an unmanaged index that is generally considered representative of large-capitalization companies on the U.S. stock market. The S&P 500 Composite Index is an unmanaged group of securities considered to be representative of the stock market in general. The Nasdaq Composite is an index of the common stocks and similar securities listed on the Nasdaq stock market and considered a broad indicator of the performance of stocks of technology and growth companies. The Russell 1000 Index is an index that measures the performance of the highest-ranking 1,000 stocks in the Russell 3000 Index, which is comprised of 3,000 of the largest U.S. stocks. The MSCI EAFE Index was created by Morgan Stanley Capital International (MSCI) and serves as a benchmark for the performance in major international equity markets, as represented by 21 major MSCI indexes from Europe, Australia, and Southeast Asia. Index performance is not indicative of the past performance of a particular investment. Past performance does not guarantee future results. Individuals cannot invest directly in an index. The return and principal value of stock prices will fluctuate as market conditions change. And shares, when sold, may be worth more or less than their original cost.
International investments carry additional risks, which include differences in financial reporting standards, currency exchange rates, political risks unique to a specific country, foreign taxes and regulations, and the potential for illiquid markets. These factors may result in greater share price volatility.
The Hang Seng Index is a benchmark index for the blue-chip stocks traded on the Hong Kong Stock Exchange. The KOSPI is an index of all stocks traded on the Korean Stock Exchange. The Nikkei 225 is a stock market index for the Tokyo Stock Exchange. The SENSEX is a stock market index of 30 companies listed on the Bombay Stock Exchange. The Jakarta Composite Index is an index of all stocks that are traded on the Indonesia Stock Exchange. The Bovespa Index tracks 50 stocks traded on the Sao Paulo Stock, Mercantile, & Futures Exchange. The IPC Index measures the companies listed on the Mexican Stock Exchange. The MERVAL tracks the performance of large companies based in Argentina. The ASX 200 Index is an index of stocks listed on the Australian Securities Exchange. The DAX is a market index consisting of the 30 German companies trading on the Frankfurt Stock Exchange. The CAC 40 is a benchmark for the 40 most significant companies on the French Stock Market Exchange. The Dow Jones Russia Index measures the performance of leading Russian Global Depositary Receipts (GDRs) that trade on the London Stock Exchange. The FTSE 100 Index is an index of the 100 companies with the highest market capitalization listed on the London Stock Exchange.
Please consult your financial professional for additional information. Copyright 2020 FMG Suite.